December 2023 San Francisco Market News

December 2023 San Francisco Market News

The Big Story

The stage is set for 2024 to look a lot different from 2023

Quick Take:

  • The Fed telegraphed that rate hikes are ending, and financial markets expect rate cuts in 2024, which will meaningfully reduce the cost of financing and increase home sales.
  • High mortgage rates continue to drive low home sales, which are down 15% year over year. However, low sales have caused inventory to build, which will benefit the 2024 market as demand increases.
  • Home prices are declining slightly, which is normal this time of year, but mortgage rates are keeping the monthly cost of financing a home at or near record highs.

Note: You can find the charts & graphs for the Big Story at the end of the following section.


The 2024 housing market may not be flaming hot like 2021, but it'll definitely be a little spicy

Even though Fed Chair Jerome Powell remarked that it’s too soon to definitively conclude that rate hikes are finished, the financial markets have, in fact, decided they’re finished. As of December 4, 2023, interest-rate futures traders (the people who make a lot of money being right about where rates will go) expect the Fed to cut the federal funds rate, which currently falls between 5.25% and 5.50%, by 1.25%.
 
As a quick recap, the Fed dropped the fed funds rate effectively to 0% at the start of the pandemic and purchased mortgage-backed securities. The already historically low average 30-year mortgage rate then fell even further, reaching a record low of 2.65% in early 2021, which fueled the housing boom from June 2020 to June 2022. Inflation spiked in 2021, hitting levels not seen since the early 1980s and causing the Fed to begin rate hikes in March 2022, which trickled through markets quickly. From the beginning to the end of 2022, mortgage rates more than doubled, ending the white hot housing market and creating the slow-paced 2023 market. Mortgage rates continued to rise in 2023, hitting a 23-year high of 7.79% in October. Luckily, the average 30-year mortgage rate contracted in November 2023, falling to 7.22% by the end of the month.
 
It’s hard to convey the full significance of higher mortgage rates on the housing market but, in short, they are the primary driver of the market slowdown. This is evidenced by the fact that the market began slowing down at almost the exact same time that the Fed began their rate hikes. In October 2023, a buyer’s monthly cost reached an all-time high when accounting for the cost of financing a mortgage. Redfin reported the highest rate of buyers backing out of home purchases on record, as home buyers experienced the sticker shock of the cost to finance the home. It should come as no surprise that sales continued to fall and will likely continue to decline through the winter months.
 
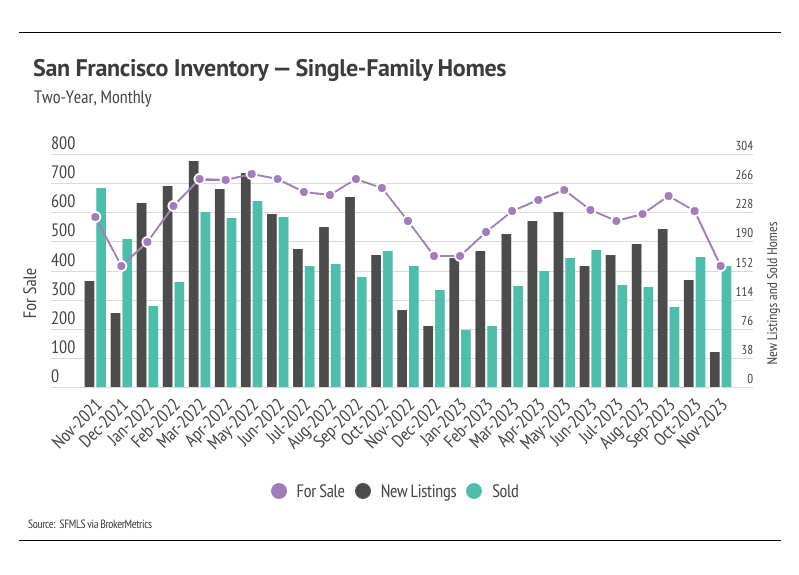
Now, back to our outlook for the year ahead. The falling sales in 2023 have allowed inventory to grow, which is much needed. Although inventory is still down 6% year over year, it has increased 20% in 2023 and will likely continue to increase through the rest of the year, which is far different from the typical seasonal trend of increasing in the first half of the year and declining in the second. In Q1 2024, we expect inventory to rise further, helping ease the low supply problem. Greater supply will be necessary because mortgage rates should decrease meaningfully with the anticipated rate cuts, driving up demand. A 1% decrease in interest rate equates to a 10% decrease in monthly financing costs. At this point, we expect a large number of would-be buyers to wait a little longer to gain more clarity around rate cuts in 2024 and hit the market in the spring and summer months.
 
Different regions and individual houses vary from the broad national trends, so we’ve included a Local Lowdown below to provide you with in-depth coverage for your area. In general, higher-priced regions (the West and Northeast) have been hit harder by mortgage rate hikes than less expensive markets (the South and Midwest) because of the absolute dollar cost of the rate hikes and limited ability to build new homes. The National Association of Realtors’ Chief Economist Lawrence Yun recently remarked that multiple offers are still occurring, especially on starter and mid-priced homes, even as price concessions are happening in the upper end of the market. As always, we will continue to monitor the housing and economic markets to best guide you in buying or selling your home.
 

Big Story Data

The Local Lowdown

Quick Take:

  • The median single-family home price declined 9.4% from October to November, while condo prices rose 1.3%. Single-family home and condo prices have hovered around $1.5 million and $1.2 million, respectively, and we expect that trend to continue until interest rates drop and more sellers come to the market.
  • Active listings in San Francisco fell month over month, as an unusually low number of new listings came to the market. Single-family home and condo inventory hit a record low in November.
  • Months of Supply Inventory for single-family homes fell significantly in October and November. While MSI still indicates a buyers’ market for condos, single-family home MSI now implies that the market strongly favors sellers.

Note: You can find the charts/graphs for the Local Lowdown at the end of this section.

Prices continue horizontal trend for both single-family homes and condos

In San Francisco, home prices haven’t been largely affected by rising mortgage rates after the initial period of price correction from May 2022 to July 2022. Since July 2022, the median single-family home and condo prices have hovered around $1.5 million and $1.2 million, respectively. Month over month, in November, the median single-family home price fell 9%, while condo prices rose 1%; but, year over year, the median prices were the same as last November for both single-family homes and condos. We expect prices to remain fairly stable in the winter months, but as interest rates decline and more sellers come to the market, prices will almost certainly rise in the first half of 2024. More homes must come to the market in the spring and summer to get anything close to a healthy market.
 
High mortgage rates soften both supply and demand, so ideally, as rates fall, far more sellers will come to the market. Rising demand can only do so much for the market if there isn’t supply to meet it. Unlike 2023, 2024 inventory has a much better chance of following more typical seasonal patterns.

Single-family home and condo inventory hit all-time lows as new listings dropped in November. 

Since the start of 2023, single-family home inventory has followed fairly typical seasonal trends, but at a significantly depressed level. Low inventory and fewer new listings have slowed the market considerably. Typically, inventory peaks in July or August and declines through December or January, but the lack of new listings prevented meaningful inventory growth. This year, sales and inventory peaked in May, while new listings peaked in September. New listings have been exceptionally low, so the little inventory growth from February to May was driven by fewer sales. The number of new listings coming to market is a significant predictor of sales. In September, new listings rose 32%, and in October, sales increased by 37%. Year over year, sales and new listings are down 10% and 28%, respectively.
 
Demand spiked in October after a surge of new listings came to market, giving sellers slightly more negotiating power, and buyers paid more than asking price on average. The average seller received 96% of list in January, which grew to 102% by June. The amount sellers received declined below list price into September 2023, but rose to 101% of list in October.

Months of Supply Inventory indicates the market shifted back to a seller's market for single-family homes

Months of Supply Inventory (MSI) quantifies the supply/demand relationship by measuring how many months it would take for all current homes listed on the market to sell at the current rate of sales. The long-term average MSI is around three months in California, which indicates a balanced market. An MSI lower than three indicates that there are more buyers than sellers in the market (meaning it’s a sellers’ market), while a higher MSI indicates there are more sellers than buyers (meaning it’s a buyers’ market). The San Francisco market tends to favor sellers, at least for single-family homes, which is reflected in its low MSI. However, we’ve seen over the past 12 months that this isn’t always the case. MSI indicated that single-family homes and condos began the year in a buyers’ market. MSI declined in the first half of the year for single-family homes, indicating that the climate shifted from a buyers’ market to a sellers’ market. However, in the third quarter, MSI rose substantially, indicating a buyers’ market once again. In October, sales rose considerably, dropping MSI below three months — back to a sellers’ market. Condo MSI moved from a balanced market at the end of the first quarter of 2023 to a buyers’ market, and it has remained a buyers’ market since April.

Local Lowdown Data


Recent Blog Posts

Stay up to date on the latest real estate trends.

April 2024 San Francisco Market News

Quick Take: The National Association of Realtors® (NAR) settled a major lawsuit in March. It’s still too early to tell exactly how real estate will be affected, since… Read more

April 2024 East Bay Market News

Quick Take: The National Association of Realtors® (NAR) settled a major lawsuit in March. It’s still too early to tell exactly how real estate will be affected, sinc… Read more

March 2024 San Francisco Market News

Quick Take: Mortgage rates rose in February, closing the month at 6.94%. However, the Fed will almost certainly cut rates at some point this year, so potential homebu… Read more

March 2024 East Bay Market News

Quick Take: Mortgage rates rose in February, closing the month at 6.94%. However, the Fed will almost certainly cut rates at some point this year, so potential homeb… Read more

February 2024 San Francisco Market News

Quick Take: After the average 30-year mortgage rate fell over 1% in November and December 2023, rates stabilized between 6.60% and 6.70% in January 2024. Median price… Read more

February 2024 East Bay Market News

Quick Take: After the average 30-year mortgage rate fell over 1% in November and December 2023, rates stabilized between 6.60% and 6.70% in January 2024. Median pric… Read more

January 2024 San Francisco Market News

Quick Take: The average 30-year mortgage rate fell 1.18% in the last two months of 2023, which is a significant drop from the 23-year high reached at the end of Octob… Read more

January 2024 East Bay Market News

Quick Take: The average 30-year mortgage rate fell 1.18% in the last two months of 2023, which is a significant drop from the 23-year high reached at the end of Octo… Read more

December 2023 San Francisco Market News

Quick Take: The Fed telegraphed that rate hikes are ending, and financial markets expect rate cuts in 2024, which will meaningfully reduce the cost of financing and i… Read more

Contact Me

Any questions at all, happy to help!

Follow Us on Instagram